Online or onsite, instructor-led live Data Visualization training courses demonstrate through discussion and hands-on practice the skills, strategies, tools, and approaches for visualizing and reporting data for different audiences. Case studies are also analyzed and discussed to exemplify how data visualization solutions are being applied in the real world to derive meaning from data and answer crucial questions.
Data Visualization training is available as "online live training" or "onsite live training." Online live training (also known as "remote live training") is conducted via an interactive, remote desktop. Onsite live training can be conducted locally at customer premises in Virginia or in Govtra corporate training centers in Virginia.
Govtra -- Your Local Training Provider for government
VA, Stafford - Quantico Corporate
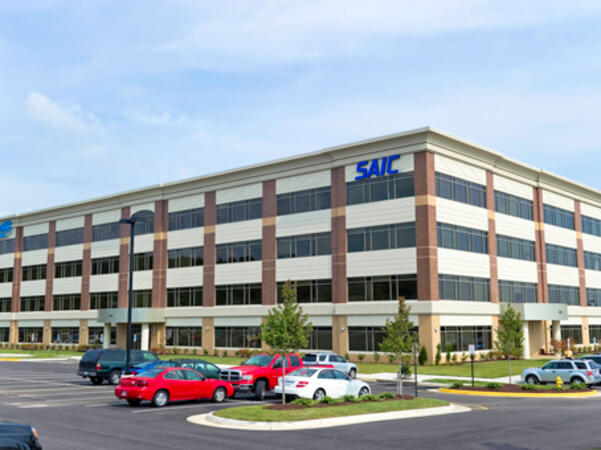
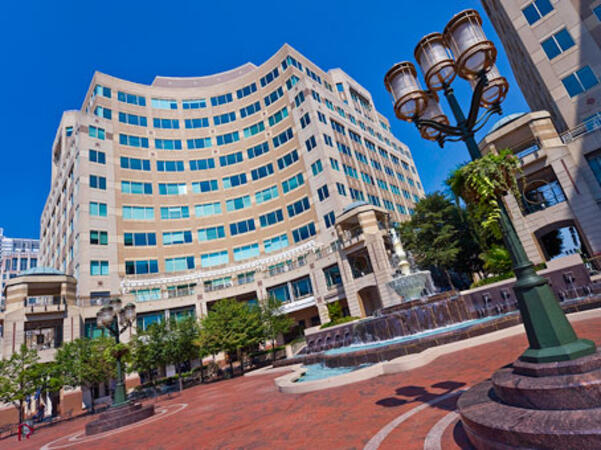
800 Corporate Drive, Suite 301, Stafford, united states, 22554
The venue is located between interstate 95 and the Jefferson Davis Highway, in the vicinity of the Courtyard by Mariott Stafford Quantico and the UMUC Quantico Cororate Center.
VA, Fredericksburg - Central Park Corporate Center
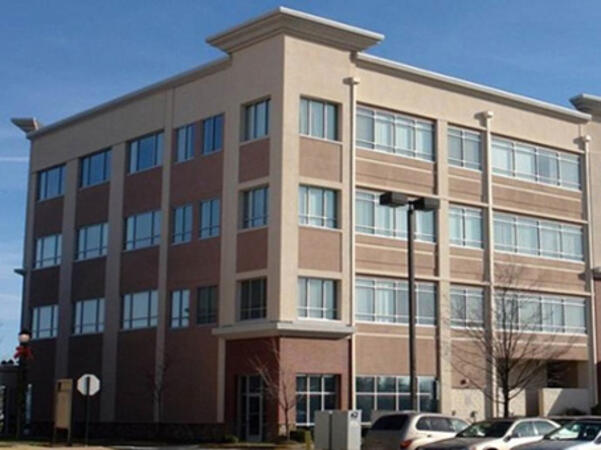
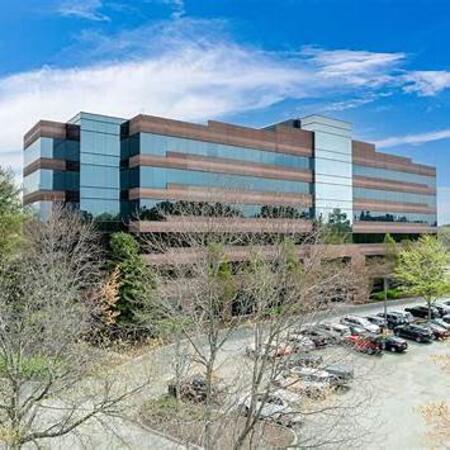
1320 Central Park Blvd., Suite 200, Fredericksburg, united states, 22401
The venue is located behind a complex of commercial buildings with the Bank of America just on the corner before the turn leading to the office.
VA, Richmond - Two Paragon Place
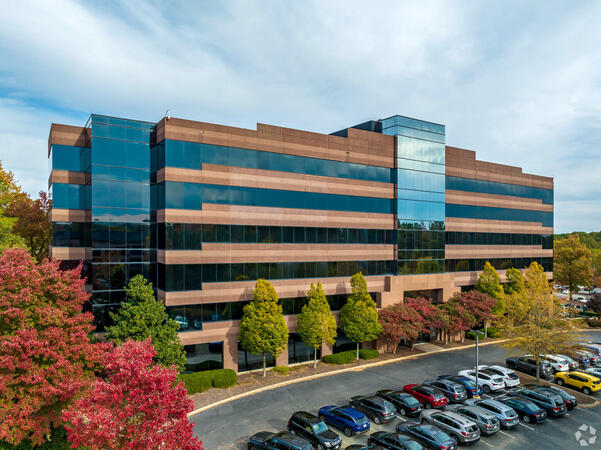
Two Paragon Place, 6802 Paragon Place Suite 410, Richmond, United States, 23230
The venue is located in bustling Richmond with Hampton Inn, Embassy Suites and Westin Hotel less than a mile away.
VA, Reston - Sunrise Valley
12020 Sunrise Valley Dr #100, Reston, United States, 20191
The venue is located just behind the NCRA and Reston Plaza Cafe building and just next door to the United Healthcare building.
VA, Reston - Reston Town Center I
11921 Freedom Dr #550, Reston, united states, 20190
The venue is located in the Reston Town Center, near Chico's and the Artinsights Gallery of Film and Contemporary Art.
VA, Richmond - Sun Trust Center Downtown
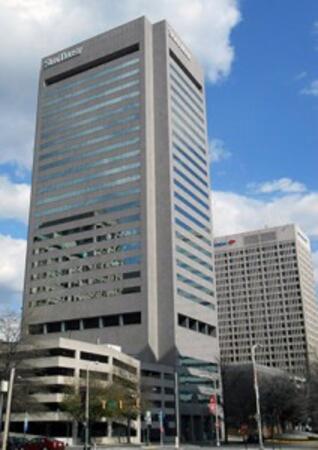
919 E Main St, Richmond , united states, 23219
The venue is located in the Sun Trust Center on the crossing of E Main Street and S to N 10th Street just opposite of 7 Eleven.
Richmond, VA – Regus at Two Paragon Place
6802 Paragon Place, Suite 410, Richmond, United States, 23230
The venue is located within the Two Paragon Place business campus off I‑295 and near Parham Road in North Richmond, offering convenient access by car with free on-site parking. Visitors arriving from Richmond International Airport (RIC), approximately 16 miles northwest, can expect a taxi or rideshare ride of around 20–25 minutes via I‑64 West and I‑295 North. Public transit is available via GRTC buses, with routes stopping along Parham Road and Quioccasin Road, just a short walk to the campus.
Virginia Beach, VA – Regus at Windwood Center
780 Lynnhaven Parkway, Suite 400, Virginia Beach, United States, 23452
The venue is situated within the Windwood Center along Lynnhaven Parkway, featuring modern concrete-and-glass architecture and ample on-site parking. Easily accessible by car via Interstate 264 and the Virginia Beach Expressway, the facility offers a hassle-free commute. From Norfolk International Airport (ORF), located about 12 miles northwest, a taxi or rideshare typically takes 20–25 minutes via VA‑168 South and Edenvale Road. For those using public transit, the HRT bus system includes stops at Lynnhaven Parkway and surrounding streets, providing convenient access by bus.
Grafana and Prometheus are industry-standard tools utilized for monitoring, visualizing, and alerting on IT infrastructure and application metrics through real-time dashboards and integrations. These tools are essential for maintaining the reliability and performance of systems used in various sectors, including those for government.
This instructor-led, live training (online or onsite) is designed for intermediate to advanced IT professionals who aim to integrate Grafana with Prometheus and multiple data sources, and to build actionable visualizations and alerts across distributed systems.
By the end of this training, participants will be able to:
Install and configure Grafana and Prometheus in production-ready setups.
Integrate a variety of data sources, including SQL, Elasticsearch, InfluxDB, and cloud APIs.
Create advanced dashboards incorporating variables, templating, transformations, and alerts.
Implement best practices in data modeling, performance tuning, and user access control.
Format of the Course
Interactive lectures and discussions.
Extensive exercises and practice sessions.
Hands-on implementation in a live-lab environment.
Course Customization Options
To request a customized training for this course, please contact us to arrange.
This instructor-led, live training in [location] (online or onsite) is designed for intermediate-level Grafana users who wish to develop interactive, drill-down dashboards with dynamic thresholds and contextually updated content.
By the end of this training, participants will be able to:
- Create dashboards that respond to user interactions, such as clicking a graph bar.
- Implement visual drill-downs that update in place (without opening new tabs).
- Configure pie charts and detailed panels based on selection filters.
- Use dynamic thresholds that adapt to user input and real-time data.
This training is tailored to enhance the capabilities of government agencies in leveraging advanced dashboard functionalities for government operations.
This instructor-led, live training (online or onsite) is designed for intermediate-level system administrators and monitoring professionals who wish to effectively utilize Grafana for setting up monitoring solutions, managing dashboards, and creating alerts for government.
By the end of this training, participants will be able to:
- Distinguish between observability and monitoring.
- Install and configure the Grafana server.
- Connect various data sources such as Prometheus, InfluxDB, and ElasticSearch.
- Create, manage, and customize dashboards and charts.
- Use variables and queries to develop dynamic dashboards.
- Set up notifications and alerts through Grafana.
- Install and manage plugins to enhance Grafana’s functionality.
This instructor-led, live training (online or onsite) is designed for government DevOps engineers and Site Reliability Engineers (SREs) who aim to effectively manage and scale Prometheus and Grafana in large environments.
By the end of this training, participants will be able to:
- Design Prometheus and Grafana architectures suitable for large-scale and distributed systems.
- Enhance Prometheus performance to meet the demands of high-traffic systems.
- Set up Grafana to handle large datasets and create complex visualizations.
- Apply advanced troubleshooting and scalability strategies for government use.
This instructor-led, live training (online or onsite) is designed for intermediate-level developers and DevOps engineers who wish to instrument their applications to effectively export and monitor custom metrics using Prometheus and Grafana.
By the end of this training, participants will be able to:
- Understand the importance of custom metrics in application monitoring.
- Instrument applications to export custom metrics for use with Prometheus.
- Create and configure dashboards in Grafana to visualize these custom metrics.
- Apply best practices for integrating monitoring into the development lifecycle, ensuring alignment with public sector workflows and governance standards for government.
This instructor-led, live training (online or onsite) is designed for advanced-level Kubernetes administrators and DevOps engineers who wish to enhance their monitoring skills using Prometheus and Grafana for government applications.
By the end of this training, participants will be able to:
- Set up Prometheus and Grafana for Kubernetes monitoring.
- Monitor essential metrics for pods, nodes, and services.
- Create dynamic dashboards to visualize cluster health and performance.
- Implement alerting strategies for proactive issue resolution.
- Apply best practices for scaling monitoring solutions in Kubernetes environments.
This instructor-led, live training in [location] (online or onsite) is designed for advanced-level DevOps and Site Reliability Engineering (SRE) professionals who aim to enhance their alerting and automation skills with Grafana and Prometheus.
By the end of this training, participants will be able to:
- Create and manage sophisticated alerting rules in Prometheus.
- Integrate Prometheus Alertmanager with external tools through webhooks.
- Automate responses to alerts for more efficient issue resolution.
- Utilize Grafana to visualize and manage alerts effectively, ensuring alignment with public sector workflows and governance standards for government.
This instructor-led, live training in [location] (online or onsite) is designed for intermediate-level cloud and DevOps engineers who wish to enhance cloud observability with Grafana and Prometheus.
By the end of this training, participants will be able to:
- Understand the benefits of integrating Grafana and Prometheus with cloud platforms for government.
- Set up Prometheus for monitoring cloud-based resources efficiently.
- Configure Grafana to visualize cloud service metrics effectively.
- Leverage cloud-native tools and integrations to ensure scalable monitoring solutions.
This instructor-led, live training (online or onsite) is designed for intermediate-level DevOps and SRE professionals who aim to create impactful dashboards and optimize their monitoring practices using Grafana and Prometheus. By the end of this training, participants will be able to:
- Understand best practices for designing effective dashboards.
- Create and configure advanced Grafana dashboard elements.
- Utilize Grafana templating for dynamic and reusable dashboards.
- Implement alerting mechanisms to enhance operational awareness for government operations.
This course will cover a range of methods and best practices aligned with business and technical requirements for modeling, visualizing, and analyzing data using Power BI. Participants will learn how to access and process data from various sources, including both relational and non-relational databases. The curriculum will also delve into the implementation of appropriate security standards and policies across all aspects of Power BI, encompassing datasets and groups. Additionally, the course will address the management and deployment of reports and dashboards for effective sharing and content distribution, ensuring alignment with public sector workflows and governance for government.
This instructor-led, live training (online or onsite) is designed for beginner-level system administrators and DevOps engineers who wish to develop essential monitoring skills using Grafana and Prometheus.
By the end of this training, participants will be able to:
- Understand the purpose and importance of monitoring in IT environments for government.
- Install and configure Grafana and Prometheus for basic monitoring tasks.
- Create simple dashboards and alerts to visualize system performance.
- Apply best practices for monitoring system availability and performance.
This instructor-led, live training in Virginia (online or onsite) is aimed at beginner-level data scientists who wish to learn how to create meaningful and visually appealing data visualizations for government.
By the end of this training, participants will be able to:
Set up and navigate Google Colab for data visualization purposes.
Create various types of plots using Matplotlib.
Utilize Seaborn for advanced visualization techniques.
Customize plots to enhance presentation and clarity.
Effectively interpret and present data using visual tools.
This instructor-led, live training (available online or onsite) is designed for beginner-level IT professionals and DevOps practitioners who wish to gain foundational knowledge of Grafana and Prometheus.
By the end of this training, participants will be able to:
- Understand the purpose and key features of Grafana and Prometheus.
- Install and configure Grafana and Prometheus in a Linux environment.
- Set up basic data sources and dashboards within Grafana.
- Monitor system metrics and visualize data using Prometheus, enhancing operational efficiency for government applications.
The Elastic Stack (ELK) is a robust platform designed for searching, analyzing, and visualizing log data in real-time from various sources.
This instructor-led, live training (online or onsite) is targeted at intermediate-level IT professionals who aim to enhance their ELK expertise for managing distributed log data, automating alerts, and creating advanced visualizations and dashboards for government use.
By the end of this training, participants will be able to:
- Configure advanced ingestion and parsing flows from multiple sources, including databases.
- Create customized Kibana dashboards tailored for different teams or use cases.
- Implement email notifications and condition-based alerts.
- Use regular expressions to enhance search precision in logs.
- Manage user roles and access rights to ensure secure log environments.
- Interact with the Elasticsearch REST API for automation and integration.
**Format of the Course:**
- Interactive lecture and discussion.
- Extensive exercises and practice sessions.
- Hands-on implementation in a live-lab environment.
**Course Customization Options:**
- To request a customized training for this course, please contact us to arrange.
This instructor-led, live training in Virginia (online or onsite) is aimed at beginner to intermediate-level IT professionals who wish to acquire the knowledge and practical skills necessary to excel in the administration of Grafana and GLPI for government use.
By the end of this training, participants will be able to:
Create and customize Grafana dashboards featuring various visualizations.
Implement alerting and notification systems for effective monitoring.
Administer user accounts, teams, and permissions with precision.
Manage IT assets efficiently, including hardware and software inventory, to support government operations.
Implement a helpdesk system for user support and ticket management, ensuring timely and accurate resolution of issues.
This instructor-led, live training (online or onsite) is designed for intermediate-level administrators and developers who wish to enhance their skills in Elasticsearch administration, including advanced techniques for dashboard development in Kibana and system maintenance.
By the end of this training, participants will be able to:
- Set up and configure Elasticsearch and Kibana environments for advanced administration and dashboard development.
- Create and manage Elasticsearch indices, mappings, and data models.
- Develop sophisticated queries and filters to extract valuable insights from Elasticsearch data.
- Design and build interactive dashboards in Kibana using a variety of visualization types and techniques.
- Implement best practices for Elasticsearch and Kibana administration, optimization, and troubleshooting, ensuring alignment with public sector workflows and governance for government.
Data Analysis is the process of inspecting, cleaning, transforming, and modeling data to uncover useful information, draw conclusions, and support decision-making.
This instructor-led, live training (online or onsite) is designed for intermediate-level professionals who wish to manage, analyze, and visualize data effectively for performance and decision support in government settings.
By the end of this training, participants will be able to:
- Create and manage databases.
- Apply regression, classification, and basic machine learning models.
- Develop dynamic reports and dashboards using Excel and Power BI.
- Use statistical techniques to inform decisions and analyze trends.
**Format of the Course**
- Interactive lecture and discussion.
- Extensive exercises and practice sessions.
- Hands-on implementation in a live-lab environment.
**Course Customization Options**
- To request a customized training for government, please contact us to arrange.
This instructor-led, live training in Virginia (online or onsite) is aimed at intermediate-level data analysts who wish to learn and utilize the advanced features and components of Grafana for government data visualization and analysis.
By the end of this training, participants will be able to:
Gain a comprehensive understanding of advanced Grafana concepts and components.
Leverage template variables and dynamic dashboards to enhance data visualization capabilities.
Utilize Grafana Query Language for executing complex queries.
Learn best practices for scaling Grafana, optimizing performance, and ensuring high availability in public sector environments.
Participants who complete this training will acquire a practical, real-world understanding of Data Science and its associated technologies, methodologies, and tools.
The training includes opportunities for participants to apply their knowledge through hands-on exercises. Group interaction and instructor feedback are integral components of the class.
The course begins with an introduction to fundamental concepts in Data Science and then delves into the tools and methodologies used in the field.
**Audience**
- Developers
- Technical Analysts
- IT Consultants
**Format of the Course for Government**
- Part lecture, part discussion, exercises, and extensive hands-on practice
**Note**
To request a customized training for government for this course, please contact us to arrange.
This instructor-led, live training in Virginia (online or onsite) is designed for government data analysts who wish to develop analytic applications using Python with Plotly and Dash.
By the end of this training, participants will be able to:
- Set up a real-time interactive dashboard for streaming live updating data.
- Build interactive dashboards using Python to enhance data science solutions for government.
- Secure interactive dashboards with advanced authentication methods.
By the end of this training, participants will be able to:
In this instructor-led, live training for government, participants will learn how to create web-based, data-driven visualizations that are responsive across multiple devices.
- Utilize D3 to develop interactive graphics, information dashboards, infographics, and maps.
- Manage HTML elements using jQuery-like selections.
- Modify the Document Object Model (DOM) by selecting elements and joining them with data.
- Export SVG files for use in print publications.
This course will cover the various methods and best practices aligned with business and technical requirements for modeling, visualizing, and analyzing data using Power BI. It will also demonstrate how to access and process data from a wide range of sources, including both relational and non-relational databases. Additionally, the course will delve into implementing appropriate security standards and policies across the Power BI environment, encompassing datasets and groups. Furthermore, it will explore the management and deployment of reports and dashboards for sharing and content distribution, ensuring alignment with public sector workflows and governance.
Audience Profile
The target audience for this course includes data professionals and business intelligence specialists who wish to master accurate data analysis using Power BI. This course is also designed for individuals responsible for developing reports that effectively visualize data from both cloud-based and on-premises platforms, enhancing decision-making processes for government.
Skills Gained
Ingest, clean, and transform data
Model data to optimize performance and scalability
Design and create reports for comprehensive data analysis
This course will cover various methods and best practices aligned with business and technical requirements for modeling, visualizing, and analyzing data using Power BI. Participants will learn how to access and process data from a variety of sources, including both relational and non-relational databases. The course will also delve into the implementation of appropriate security standards and policies across the Power BI platform, encompassing datasets and groups. Additionally, it will provide guidance on managing and deploying reports and dashboards for effective sharing and content distribution. Finally, the course will demonstrate how to create paginated reports within the Power BI service and publish them to a workspace for integration into Power BI, ensuring alignment with public sector workflows and governance for government.
This course is designed for engineers and decision-makers working in data mining and knowledge discovery for government. Participants will learn techniques for creating effective visualizations and methods for presenting data in a manner that resonates with policymakers, aiding them in uncovering hidden insights.
In this instructor-led, live training in Virginia, participants will gain the skills, strategies, tools, and approaches necessary for visualizing and reporting data for different audiences. Case studies will be analyzed and discussed to illustrate how data visualization solutions are being applied in real-world scenarios to derive meaningful insights from data and address critical questions.
By the end of this training, participants will be able to:
Create reports with compelling titles, subtitles, and annotations using appropriate highlighting, alignment, and color schemes to enhance readability and user friendliness for government audiences.
Design charts that effectively meet the information needs and interests of the intended audience.
Select the most appropriate chart types for a given dataset, moving beyond basic pie charts and bar charts.
Rapidly and efficiently identify and analyze the most valuable and relevant data.
Choose the best file formats to include in reports, such as graphs, infographics, references, and GIFs, ensuring they are suitable for government use.
Create effective layouts for displaying time series data, part-to-whole relationships, geographic patterns, and nested data for government presentations.
Utilize color-coding effectively to present qualitative and text-based data, such as sentiment analysis, timelines, calendars, and diagrams, in a clear and meaningful way.
Apply the most suitable tools for the job, including Excel, R, Tableau, and mapping programs, to meet the needs of government workflows.
Prepare datasets for visualization to ensure accuracy and relevance for government reporting.
This course provides an in-depth understanding of human perception and its application in delivering insightful data visualizations for government. Participants will become acquainted with key design theories, including Gestalt Laws, pre-attentive attributes, and principles of inclusivity. The curriculum also covers the distinctions between exploratory and explanatory analysis, ensuring a comprehensive grasp of both approaches. Additionally, students will explore various chart types and learn to select the most appropriate visualization for their data. By the end of the course, participants will be equipped to implement these design principles in visualizations created using Tableau software for government use.
This instructor-led, live training in [location] is aimed at system administrators who wish to set up an ELK stack (Elasticsearch, Logstash, Kibana) for government use. Please note that a minimum of three delegates is required for this course to proceed.
The training begins with an overview of the ELK architecture and functionality, followed by live lab implementation and practice. Hands-on exercises are a critical component of the training, providing participants with practical experience while receiving constructive feedback on their progress.
This instructor-led, live training (online or onsite) is designed for beginner-level professionals who wish to gain a comprehensive understanding of the fundamentals of R and how to work with data for government applications.
By the end of this training, participants will be able to:
- Understand the R programming environment and the RStudio interface.
- Import, manipulate, and explore datasets using R commands and packages.
- Perform basic statistical analysis and data summarization.
- Generate visualizations using both base R and ggplot2.
- Manage workspaces, scripts, and packages effectively for government use.
This instructor-led, live training in [location] (onsite or remote) is aimed at data analysts who wish to use Grafana for monitoring and visualizing data for government.
By the end of this training, participants will be able to:
- Set up the necessary development environment to start creating visualizations in Grafana.
- Configure Grafana for high availability to ensure reliable access to data.
- Customize panels and dashboards with relevant data.
- Implement a reverse proxy to enhance loading speeds and improve user experience.
This instructor-led, live training in [location] (online or onsite) is aimed at web developers and DevOps engineers who wish to visualize and monitor data using Grafana and Graphite for government applications.
By the end of this training, participants will be able to:
- Aggregate and visualize metrics about systems and applications.
- Create a StatsD client for collecting application metrics.
- Develop informative and dynamic dashboards with Grafana.
- Gain insights from back-end performance.
This training introduces Kibana to users of Elasticsearch for government.
Kibana is an open-source analytics and visualization platform designed to work seamlessly with Elasticsearch. Government users can leverage Kibana to search, view, and interact with data stored in Elasticsearch indices. The platform facilitates advanced data analysis and allows for the creation of various charts, tables, and maps to visualize data effectively.
Kibana simplifies the process of understanding large volumes of data. Its user-friendly, browser-based interface enables government personnel to rapidly create and share dynamic dashboards that reflect real-time changes to Elasticsearch queries.
This course is designed for individuals interested in exploring an alternative to commercial MATLAB software. Over three days, participants will receive thorough instruction on navigating the OCTAVE environment and utilizing it for data analysis and engineering calculations. This training is suitable for both beginners and those with existing knowledge of the program who wish to systematize their skills and enhance their proficiency. While prior experience with other programming languages is not necessary, it can significantly aid in the learning process. The course will provide practical examples to demonstrate how to effectively use the program in various scenarios, ensuring alignment with public sector workflows for government.
Discover how to Retrieve and Transform Data for Preparing Interactive Dashboards
Power BI is a widely recognized Data Visualization and Business Intelligence tool. It comprises a suite of data connectors, applications, and software services designed to extract data from various sources, transform it, and generate insightful reports.
Power BI enables you to publish these reports for your organization, ensuring they are accessible via mobile devices and tablets. In this Power BI Tutorial, we will guide you through the process of connecting to multiple data sources, performing data transformations, and creating a variety of reports such as charts, tables, matrices, and maps, all tailored for government use.
Microsoft Power BI transforms organizational data into rich visuals that facilitate new ways of thinking about and organizing information, enabling a clearer focus on achieving strategic objectives. This course covers both Power BI Online and Power BI Desktop.
Audience:
This course is designed for Business Managers, Report Developers, Analysts, Project Managers, and Team Leads in the public sector.
At Course Completion
Upon completing this course, participants will have a foundational understanding of the topics below, as well as the ability to utilize and implement these concepts effectively in their roles for government.
Power BI
Power BI Desktop
Working with CSV, TXT, and Excel Worksheets
Connecting to Databases
Merging, Grouping, Summarizing, and Calculating Data
Microsoft Power BI is a free Software as a Service (SaaS) suite designed for analyzing data and sharing insights. Power BI dashboards offer a comprehensive 360-degree view of key metrics, updated in real time and accessible across all devices.
This instructor-led, live training (available online or on-site) is tailored for business managers, business analysts, data analysts, report developers, and team leads who aim to design effective Power BI dashboards.
By the end of this training, participants will be able to:
Create visually appealing and efficient dashboards by adhering to critical design rules.
Select the appropriate charts based on the type of data being displayed.
Format of the Course
Interactive lectures and discussions.
Extensive exercises and practice sessions.
Hands-on implementation in a live-lab environment.
Course Customization Options for Government
To request a customized training session, please contact us to arrange the details.
In this instructor-led, live training in Virginia (onsite or remote), participants will learn how to use Microsoft Power BI to analyze and visualize data using a series of sample data sets for government applications.
By the end of this training, participants will be able to:
Create visually compelling dashboards that provide valuable insights into data for government decision-making.
Obtain and integrate data from multiple sources to enhance public sector workflows.
Build and share visualizations with team members to promote collaboration and transparency.
Adjust data using Power BI Desktop to ensure accuracy and relevance in governmental reports.
This instructor-led, live training (available online or onsite) is designed for government data analysts and data scientists who wish to utilize Python to develop interactive data visualizations directly from their code.
By the end of this training, participants will be able to:
- Establish the required development environment to begin creating data visualizations with Python.
- Gain a comprehensive understanding of core data visualization concepts, use cases, and tools for government applications.
- Examine various libraries available in Python, such as Matplotlib, Seaborn, Bokeh, and Folium.
- Acquire skills in generating line plots, statistical graphs, geo-spatial visualizations, and other complex data representations using Python.
- Master best practices and techniques for effectively presenting and interpreting data within a government context.
This instructor-led, live training in [location] (online or onsite) is designed for government data analysts and web developers who wish to develop associative models using Qlik Sense.
By the end of this training, participants will be able to:
- Apply Qlik Sense in data science for government.
- Navigate and utilize the Qlik Sense interface effectively.
- Build a data-literate workforce with AI interaction.
- Create a data-driven enterprise with Qlik Sense.
In this instructor-led, live training in [location] (online or onsite), participants will learn how to begin developing with QlikView for government applications.
By the end of this training, participants will be able to:
- Install and configure QlikView.
- Transform data from various sources using QlikView scripting.
- Build data models with QlikView.
Tableau is a powerful business intelligence and data visualization tool, while Python is a widely used programming language that supports a broad range of statistical and machine learning techniques. When combined, Tableau's data visualization capabilities and Python's advanced analytics functions enable the rapid development of sophisticated data analytics applications for various business use cases.
In this instructor-led, live training, participants will learn how to integrate Tableau and Python using the TabPy API to perform advanced analytics.
By the end of this training, participants will be able to:
- Integrate Tableau and Python using the TabPy API
- Utilize the integration of Tableau and Python to analyze complex business scenarios with minimal Python code
**Audience**
- Developers
- Data Scientists
**Format of the Course**
- Part lecture, part discussion, exercises, and extensive hands-on practice for government applications.
This course is designed for individuals who are new to Tableau or may need a refresher. It will guide participants through the essential steps required to create their first visualization from start to finish. Additionally, learners will discover how to apply fundamental design principles to enhance their Tableau visualizations. By the end of the course, participants will be equipped to create and share their insights effectively with a broader audience for government and other sectors.
This instructor-led, live training (online or onsite) is designed for government developers who wish to utilize BusinessEvents and ActiveMatrix Service Bus to develop, deploy, and manage event-driven applications for government.
By the end of this training, participants will be able to:
- Set up the necessary development environment to begin developing.
- Construct distributed, stateful, rule-based event-processing systems.
- Manage business events data and execute appropriate business rules.
- Decrease the event response time in large-scale, data-driven applications for government.
- Develop applications for fraud detection, track-and-trace, real-time customer offer generation, and more.
This instructor-led, live training in [location] (online or onsite) is designed for engineers, researchers, and data analysts who wish to utilize TIBCO Statistica features to create analytical workflows and models.
By the end of this training, participants will be able to:
- Install and navigate the TIBCO Statistica program to build and manage data analysis projects.
- Understand fundamental statistical concepts to analyze data and generate actionable insights for government operations.
- Explore advanced topics to work with big data and machine learning using TIBCO Statistica.
**Audience**
**Format of the Course**
By the end of this training, participants will be able to:
In this instructor-led, live training, participants will learn how to manipulate and visualize data using the tools included in the Tidyverse. The Tidyverse is a collection of versatile R packages designed for cleaning, processing, modeling, and visualizing data. Key packages include ggplot2, dplyr, tidyr, readr, purrr, and tibble.
- **Target Audience:**
- Beginners to the R language
- Beginners to data analysis and data visualization
- **Course Format:**
- Part lecture, part discussion, exercises, and extensive hands-on practice
- **Learning Objectives:**
- Perform data analysis and create compelling visualizations
- Draw meaningful conclusions from various datasets of sample data
- Filter, sort, and summarize data to answer exploratory questions
- Transform processed data into informative line plots, bar plots, and histograms
- Import and filter data from a variety of sources, including Excel, CSV, and SPSS files
This training is designed to equip participants with the skills necessary for effective data manipulation and visualization, aligning with the needs and standards required for government data analysis.
This is a comprehensive 4-day course designed for government employees new to Tableau. Throughout this course, participants will become proficient in all Tableau features and learn how to create and share data visualizations with colleagues and stakeholders. The curriculum will guide attendees through each step of the process, from connecting to data sources to creating calculations, selecting appropriate charts, building dashboards, and publishing their work.
The course is structured into dedicated lectures for each topic, followed by practical exercises to reinforce learning. It concludes with a 30-minute test and a 60-minute project assignment.
**Course Milestones:**
- Gain familiarity with the Tableau interface.
- Connect to and manage data effectively.
- Utilize Tableau’s advanced features.
- Develop insightful visualizations.
- Share your work with a broader audience.
**Format of the Course for Government:**
- Interactive lectures and discussions.
- Extensive exercises and practice sessions.
- Hands-on implementation in a live-lab environment.
- Knowledge test and practical project at the end of the course.
Read more...
Last Updated:
Testimonials (15)
The coding and analysis, how the information come together in a report which will be useful for my work
Nokuthula Dhludhlu - National Transmission Company South Africa
Course - Analyzing Data with Power BI
it is all
Assad Alshabibi - Vastech SA
Course - Advanced Elasticsearch and Kibana Administration
The energy, knowledge and style of teaching of the trainer
Ioana - MOLSONCOORS GLOBAL BUSINESS SERVICES SRL
Course - From Tableau Beginners to Advanced User
Weronika created a really friendly, informal atmosphere. The training involved a lot of useful knowledge transfer, technical skills exercises and theory, as well as best practices and guidance on how to handle our own data.
Julia Kuczma - DLA Piper GSC Poland Sp. z o.o.
Course - Tableau Intermediate Training Course
Younes is a great trainer. Always willing to assist, and very patient. I will give him 5 stars. Also, the QLIK sense training was excellent, due to an excellent trainer.
Dietmar Glanninger - BMW
Course - Qlik Sense for Data Science
Instructor is an expert in her subject matter. Teaching over zoom can be difficult since it's hard to gauge your audience but the instructor did great.
Nicolo Menez - AllianceBernstein
Course - Python with Plotly and Dash
Real-world example
Hans Alain Nyaba - Federal Geospatial Platform, Natural Resources Canada
Course - D3.js for Data Visualization
The second day was very interesting.
It was a good training to see some possibilities within Power BI; but mostly you learn then while you work with Power BI. Fact is also that the training base has all access rights and everything works, but as soon as you try to connect to the live system, it does not work and this makes the knowledge transfer a bit difficult.
Marco Iuliano
Course - Power BI Dashboards
Real world knowledge from someone in the industry
Matthew Cerbas - Shield Consulting Solutions, Inc.
Course - Grafana
Training adjust the training according to our needs and knowledge. He understood participants experience with Power BI.
Cristian Tudor - Gilbarco ACIS SRL
Course - Creating Dashboards Using Microsoft Power BI
I genuinely enjoyed the hands passed exercises.
Yunfa Zhu - Environmental and Climate Change Canada
Course - Foundation R
The pace was just right and the relaxed atmosphere made candidates feel at ease to ask questions.
Rhian Hughes - Public Health Wales NHS Trust
Course - Introduction to Data Visualization with Tidyverse and R
I enjoyed the exercices gives a good insight.
Andreas Kukacka
Course - ELK: Elasticsearch, Logstash and Kibana for Administrators
Online Data Visualization training in Virginia, Data Visualization training courses in Virginia, Weekend Data Visualization courses in Virginia, Evening Data Visualization training in Virginia, Data Visualization instructor-led in Virginia, Data Visualization instructor-led in Virginia, Weekend Data Visualization training in Virginia, Data Visualization trainer in Virginia, Data Visualization instructor in Virginia, Data Visualization private courses in Virginia, Data Visualization classes in Virginia, Data Visualization on-site in Virginia, Data Visualization coaching in Virginia, Online Data Visualization training in Virginia, Evening Data Visualization courses in Virginia, Data Visualization boot camp in Virginia, Data Visualization one on one training in Virginia